AI agent monitoring and observability
Discover every agent and harness across endpoints, servers, and containers. Stream every action into your observability stack, attributed to the agent and session behind it.
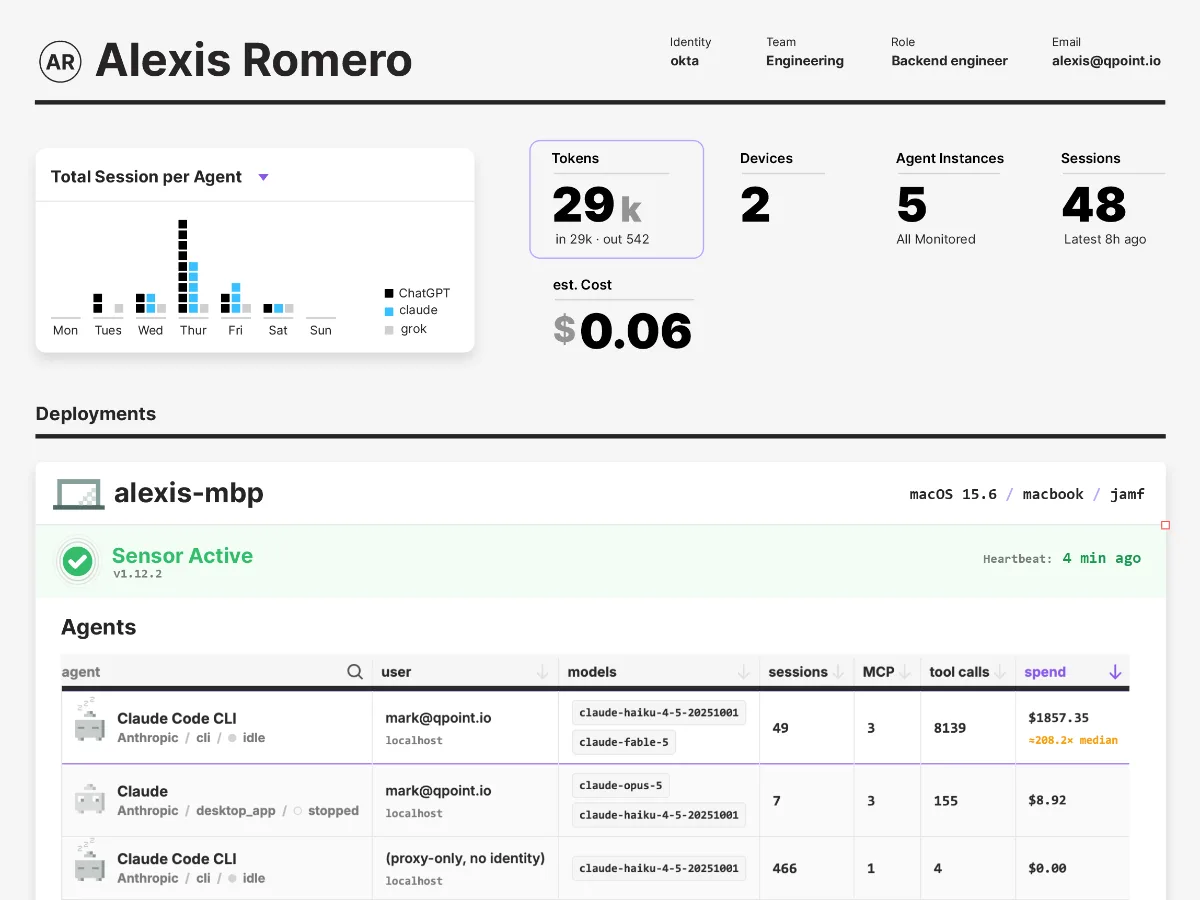
From install to insight in seconds
One binary finds every agent, records every action, and ships the record to the tools you already run.
1. Discover
Find every agent and harness in the fleet
- Live inventory of every agent on the machine
- Any runtime, framework, or harness
- No wrappers, no SDKs, no configuration
2. Observe
Record every agent action as it happens
- Every file read, write, and permission change
- Every tool call, MCP route, and outbound request
- Every process, sub-agent, and LLM call
3. Export
Ship the record to your observability stack
- Events normalized into a single stream
- Usage and cost by team, provider, and agent
- Your dashboards and alerting, now agent-aware
Questions you can finally answer
From how many agents are running to why the model bill doubled, all from the same event stream.
Agent inventory
Every agent, host, user, and version. New agents appear the moment they start.
Shadow agent discovery
Agents are found by behavior, not a list of known binaries. Unknown agents surface in seconds.
MCP server and tool inventory
Every MCP server and the tools it exposes, by user, host, and agent.
Session audit trail
The ordered sequence of reads, tool calls, spawns, and requests behind any session.
File access tracking
Every file an agent touches, with reads of sensitive paths tagged automatically.
Outbound connection tracking
Every request with the agent and action that triggered it. LLM calls are parsed by provider and model.
Sub-agent and process lineage
Every process traced back through the chain to the agent and prompt that started it.
Token usage and spend
Token usage rolled up by team, provider, model, and agent.
Export to SIEM and observability
Structured events ship to Splunk, Datadog, Elastic, and your existing pipelines.
Forty seconds, six events, one answer
An engineer reports a deploy script was modified unexpectedly. Incident response searches for writes to that file and lands on a session.
The trace shows the agent read a README with embedded instructions, called a shell tool, and rewrote the script — all within forty seconds.
Nobody asked the developer; nobody needed the agent's own logs.
AI agent operations, end to end
The same binary that records what agents do also sets the rules for how they're used and enforces them at the source. Monitor, govern, and secure share one install and one event stream.
Seconds, not sprints
Qpoint deploys as a single binary directly on the endpoint. No gateways to route through, no enterprise infrastructure to provision, no SDK integration to schedule.
Install, run, and start seeing every AI agent on the machine — in under a minute.